- A Closer Look at the Numbers and Policy Recommendations
- This report was completed in 2001. We will be updating it soon to include data current to 2004. Stay tuned.
Special Note: For a good history of downtown housing losses go to Real Change Story by Trevor Griffey entitled: : A Prologue to Homelessness
The City’s Inventory of Downtown Low Income Housing Inflates Total:
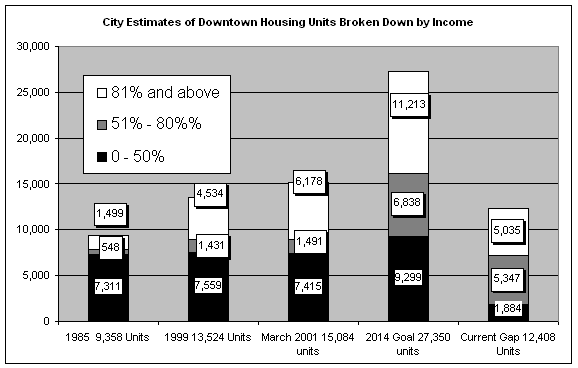
Recently, the claim has been made that Seattle’s downtown has experienced an “increase” in the supply of low income housing (priced at what is affordable to households earning at or below 50 percent of median income). Conversely, it has been claimed that the City is falling short of its longterm goal of providing “moderate” income units in the downtown area (priced at what is affordable to households earning between 50 percent and 80 percent of median income). These claims are based on information contained in a recently updated survey of the downtown housing stock, completed by the City’s Office of Housing in March of this year.
The City’s study alleges that since 1985, there has been a slight increase in the number of low income units from 7311 to 7415 units, while the number of moderate income units has risen from 548 to 1491 units. More importantly, the numbers suggest that given current trends, the City will fall far short of the City’s longterm growth management goal of adding another 5347 moderate income units in downtown by the year 2014. By contrast, it is claimed that we are only 1884 units away from our low income goals for downtown for the year 2014. (See Chart #1 below)
Actual Numbers Diametrically at Odds with City Numbers – Low Income Housing Down, Moderate Income Housing Up:
The City’s assessment of the downtown housing stock is based on a survey taken of every apartment building currently occupied in downtown Seattle. To confirm or refute the veracity of the City’s numbers, the Displacement Coalition conducted its own survey of the downtown housing supply. Time and resource constraints prohibited us from contacting the managers of all buildings in downtown so we selected a sample of buildings – 41 in all - that according to the City contained 2592 low income units. These were also buildings that we believed would be vulnerable to conversion to higher rents – buildings that had private owners who were not bound by longterm subsidy contracts to maintain the units in a low income category. Drawing from this sample, we contacted either by phone or in-person, the apartment managers of each building.
We specifically asked managers to verify the size (SRO, studio, 1-bedroom, 2-bedroom, etc), the number of units in their building at each rent level, and the range of rents offered for each size of unit. We have attached in the appendix of this report, our raw data showing exact rents in each of these 41 buildings. We also used the most recent HUD adjusted income figures (updated April 2001) to calculate the current thresholds for rents affordable to households with incomes at or below 50% (low income) and those between 50% and 80% (moderate income) and used this as our basis for determining if a unit could be placed in low income and moderate income category.
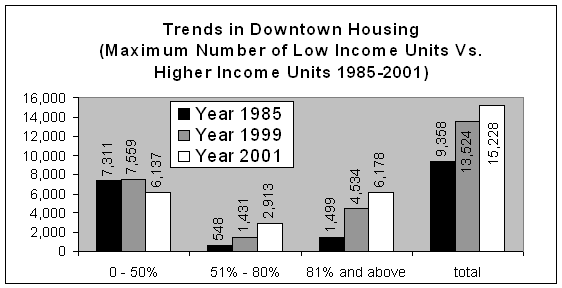
Of 2592 “low income units” surveyed by the City, we found that only 1170 remain as “low income.” The other 1422 units drawn from this total now have moved into the 50-80 percent or moderate income category. In effect, our corrected numbers show a substantial drop in low income units from7559 identified in the City’s 1999 study to a maximum of 6137 units today and a substantial increase in the number of moderate income units (50-80% of median) from a total of 1431 in 1999 to 2913 units today. (See Chart #2 below for corrected housing totals)
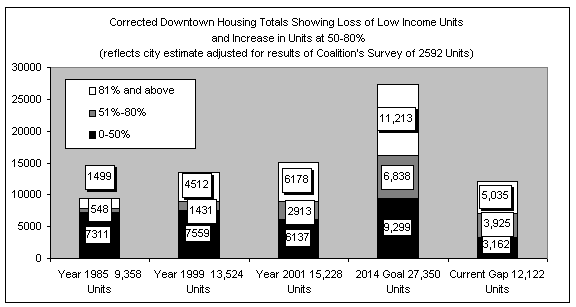
Contrary to the City’s findings, the corrected figures show that we are making considerable progress in meeting the City’s year 2014 moderate income goals. Whereas the City estimates a gap of 5,347 moderate income units, there currently is a maximum gap of 3,925). Conversely, we have seen a substantial drop in the total number of low income units in downtown and we are falling further behind in our efforts to meet the year 2014 goal of 9,299 low income units. The gap for low income units is 3,162 and contrary to trends in high and moderate income housing, that gap is growing.
Special Note: The City's estimates of the total number of low income housing units in downtown are a moving target. On city website: Seattle Office of Housing (you'll see that there is a link to a "downtown housing report". On that report, the City identifies a total of 6802 low income units priced at or below 50 percent of area median (Dec. 2001). But go to the current city website: http://www.seattle.gov/DCLU/Planning/Commdev/Downtown/DEIS/CH3-02_Housing.pdf (see page 4 of that document), you'll see a substantially reduced total of 5825 low income units also as of 2001. However, this lower number is included in a very recent city document, the draft EIS for revised zoning and land use policies for downtown. It seems to suggest that city planners have sobered up and have dropped their numbers down to the more accurate lesser figure which is in line with our figures described in this report.
Using our collected data, another 400-600 “Low Income Units” from our "6137" total may have moved up to the “Moderate Income” category (bringing our numbers very close to the City's newer figures contained in the draft EIS for downtown:
Also, because we were not able to survey all of the “unsubsidized” privately owned buildings containing units that the City has identified as low income, we believe there may be as many as 400-600 additional units marked in the City study as “low income” that actually are priced in the 50-80 percent category. If this is true this would mean that in reality, there are only about 5600 remaining low income units in the downtown area, substantially below the 7415 total included in the City’s March 2001 study. (See appendix for list of these buildings)
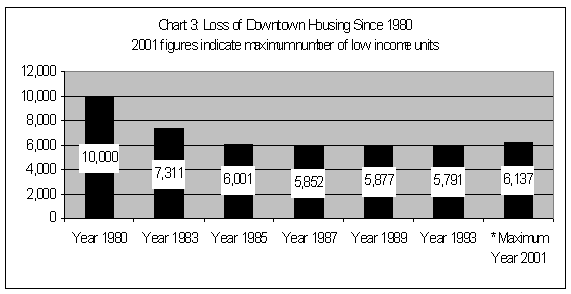
Chart #3 below provides a look at the supply of low income units in downtown over time dating back to 1985 when the commitment to maintain 7311 low income units was made. All of the numbers except the 1993 and 2001 numbers are taken directly from city surveys of the downtown low income housing supply. Our 1993 numbers are drawn from a study paid for by the office of neighborhoods through a matching grant to the Downtown Resident Outreach Planning Project (DROPP – see Office of Neighborhoods for Copy of Study).
City Now Violating it’s 1985 Commitment to preserve 7311 Downtown Low Income Units:
Furthermore, note that in 1985 the City made a “commitment” to maintain a minimum number of 7311 low income units in downtown Seattle and to expand that number. That commitment is still an integral part of the City’s downtown plan. Note that it is more than a goal. It also represents a commitment by the City to alter its policies should we fall below that 7311 total or fail to go beyond it. It is clear from these current adjusted numbers that we are falling substantially below city commitments.
The region’s affluence has substantially inflated the city’s median income while low income people fall farther behind – the inflated median also inflates our definition of low income:
Given how high the median income is in Seattle (now over $65,000 for a family of four), a rental unit can be defined as low income (priced at or below that 50% threshold) if it does not exceed $631 a month for a studio or $722 a month for a 1-bedroom unit. When you consider that most landlords now do not include utility costs in that rent – and those charges would add another $20-$40 per month to the rent – these rent levels as a practical matter, are far in excess of what most longtime low income downtown residents can afford. Only four years ago, the low income threshold was defined as $452 for a studio and $482 for a one-bedroom (at a time when more landlords also were willing to cover utility costs in that rent). Effectively, the definition of “low income” has risen in four years by over 30 percent. It’s a cinch that the income of long time downtown low income residents has not risen at this rate, if at all. Consider that when the past census was taken in 1990, over half of all downtown residents had incomes of less that $15,000, over 30 percent were living on some form of public assistance, and nearly a quarter lived below the federal poverty level earning less that $10,000 in income.
What this inflated median income threshold means is that over time, our definition of low income is also being inflated, outpacing what many longtime low income residents can afford. Throughout the latter part of this decade, it also allowed the City to take an increasing number of “moderate income” units (those previously identified in the 50-80% category) and place them into the low income category (since they now fell into the “low income” range because of those inflated 50% thresholds).
Why the City’s current tally of low income units is exaggerated.
While the City was able to use this inflated low income threshold to increase
the number of downtown low income units, as our survey indicates, the city also
placed many units in that low income category that should have remained in the
moderate income category – that were priced above even these inflated 50 percent
levels. There are several reasons why this may have occurred. The City’s results
may simply be inaccurate because they failed to speak with the individual
managers of each building included in their low income count – or they failed to
conduct these interviews for every building in the most recent update of their
survey. The other factor is that given the hot housing market, rents may have
risen dramatically since the City interviewed managers of each “low income”
apartment building. Rents in many formerly low income “unsubsidized” and
privately owned buildings indeed have been pushed above even these inflated low
income thresholds and into the moderate income category. What’s interesting
is that in spite of how high the median income is in Seattle – the median jumped
by nearly 20 percent between 1997 and 2001 – rents in many downtown unsubsidized
and formerly low income units seem to be rising at an even more dramatic pace.
Policy Recommendations and Implications:
There are several significant policy implications associated with the corrected city estimates for low income and moderate income units in downtown Seattle. We recommend that the City take the following actions in order to meet its 1985 “commitment” to preserve 7311 downtown low income units and in order to make its 2014 goal of 9299 low income units. Note also that the 1985 commitment is written into the downtown land use plan and it is more than a goal. It obligates the city to implement new policies and laws to ensure the commitment is fulfilled.
1. Retain and enhance the “low income” focus of the downtown TDR/Bonus System:
The city’s Downtown Bonus and TDR (Transfer of Development Rights) System effectively reward developers with additional office and hotel space above normal zoning requirements provided they agree to commit a set amount of revenue toward either the construction or preservation of low income housing. Since it is alleged that we are meeting and even exceeding our low income downtown housing goals, the changes introduced by the Mayor’s office effectively would shift the emphasis of the programs towards the provision of moderate” income units.
Our adjusted numbers indicate that a shift from the promotion of low income to higher income units (through changes in the TDR/Bonus system) would only reinforce what already is happening out there in the market anyway. Downtown already is seeing a dramatic growth in the number of moderate priced units (priced between 50-80 percent of median). This growth of moderate priced units is occurring as a result of market forces boosting formerly low income units into the moderate income category. Effectively a heated-up housing market is doing more to produce moderate priced units than any change in the TDR and bonus system ever could do.
Our numbers highlight not only the need to retain the current emphasis of the bonus system on low income over moderate income units, it highlights the need to enhance that low income emphasis. For example, we believe that the City should be insisting that developers who take advantage of the bonus system be required to pay more on a per square foot basis for any additional office or hotel space they seek to build above base floor area limits. The added proceeds should then be dedicated to the construction of low income (at or below 50 % of median) and very low income housing (at or below 30% of median).
2. The new housing levy should include a special allocation set-aside for purchase and renovation of remaining “unsubsidized” downtown low income buildings and the levy must continue to emphasize serving the poorest of the poor – those with incomes at or below 30 percent of area median?
The City also is currently immersed in planning for another low income housing levy and is now making critical decisions on where to place their emphasis – whether to continue to allocate the bulk of revenues raised by a levy for low income units (below 50 percent of median) or to increase the portion going serve households with income between 50 and 80 percent of median. We should continue to allocate the bulk of levy funds for the poorest of the poor – those with incomes at or below 30 percent of median. In addition, past levies have also included specific language ensuring an equitable geographic distribution of levy funds with the downtown actually getting a slightly greater share of the revenues given the high concentration of such units and the inordinately high need in downtown. That practice should be part of any new housing levy.
3. Other critical land use and policy decisions must take our adjusted numbers into consideration:
There are numerous other critical decisions related to zoning, design review, environmental review, where these numbers are used to justify (or rationalize) individual developer decision that affect low income housing. The city should correct these numbers immediately and make sure that they are used in any context where planning and development decisions are being made affecting our low income housing stock.
4. The city should adopt new “legally defensible” policies to prevent the continued loss of low income downtown housing to demolition, abandonment, and increased rents?
The most important implication of our findings is that our adjusted numbers show a continued decline in the supply of low income downtown housing. This demonstrates a significant need to adopt new laws and policies aimed at preserving what is left of our downtown low income housing stock. The trends we see in downtown also mirror what is happening in all of Seattle’s neighborhoods. Until we secure passage of new laws like a “right of first refusal” law that can help us prevent the continued erosion in the supply of low income downtown housing units, we will always see increasing numbers of low income people on our downtown streets. Our adjusted numbers showing continued losses of downtown housing highlight why now, more than ever, we need to take more aggressive action to prevent the continued loss of our existing low income supply. Other legally defensible mechanisms to consider would include use of the city’s condemnation powers and “eminent domain” to secure in public ownership a growing share of our city and downtown’s low income housing stock held in private hands. Use of special review districts that operate as overlays to existing zoning and located in areas where there are high concentrations of low income units should also be considered.
- John V. Fox
for the Coalition
This report was completed with the help of David Lawton and Sinan Dimeral who conducted most of the interviews with downtown apartment managers.